While demographic estimates of undocumented immigrants in the United States are difficult to estimate, the Migration Policy Institute provided the following estimates for the undocumented population living in the country in 2019, based on US Census Bureau data from the 2015-2019 American Community Survey (ACS) and the 2008 Survey of Income and Program Participation (SIPP). The demographic estimates are based on a population estimate of 11,047,000 undocumented immigrants.

| Country | Undocumented Population in the United States | % of Total Undocumented Population in the United States |
|---|---|---|
| Mexico | 5,313,000 | 48% |
| El Salvador | 741,000 | 7% |
| Guatemala | 724,000 | 7% |
| India | 553,000 | 5% |
| Honduras | 490,000 | 4% |
| Other | 3,226,000 | 29% |

| Region | Undocumented Population in the United States | % of Total Undocumented Population in the United States |
|---|---|---|
| Mexico & Central America | 7,381,000 | 67% |
| Asia | 1,697,000 | 15% |
| South America | 907,000 | 8% |
| Europe/Canada/Oceania | 440,000 | 4% |
| Caribbean | 327,000 | 3% |
| Africa | 295,000 | 3% |
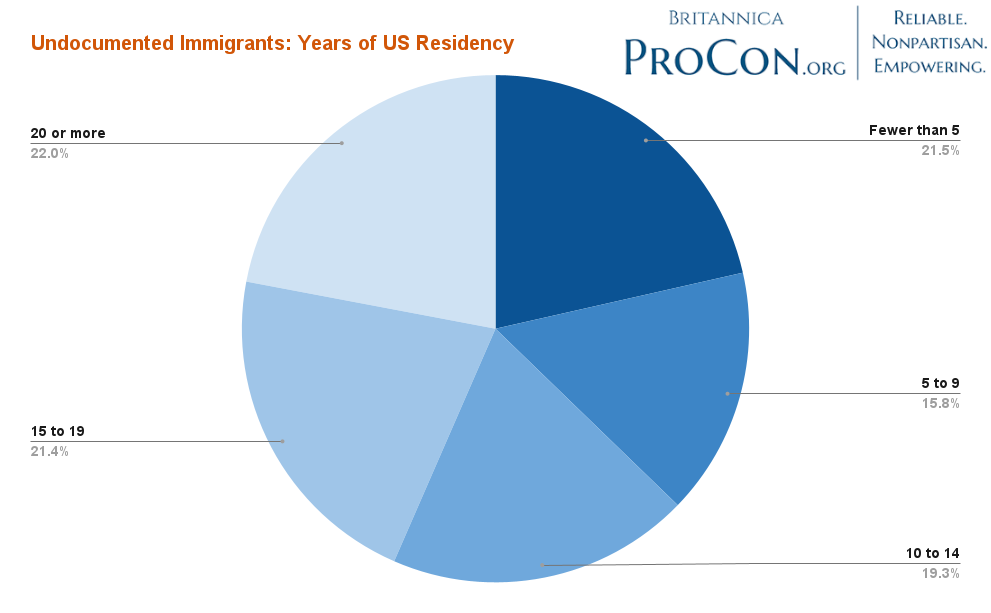
| Years | Undocumented Population in the United States | % of Total Undocumented Population in the United States |
|---|---|---|
| Fewer than 5 | 2,370,000 | 21% |
| 5 to 9 | 1,744,000 | 16% |
| 10 to 14 | 2,132,000 | 19% |
| 15 to 19 | 2,368,000 | 21% |
| 20 or More | 2,433,000 | 22% |
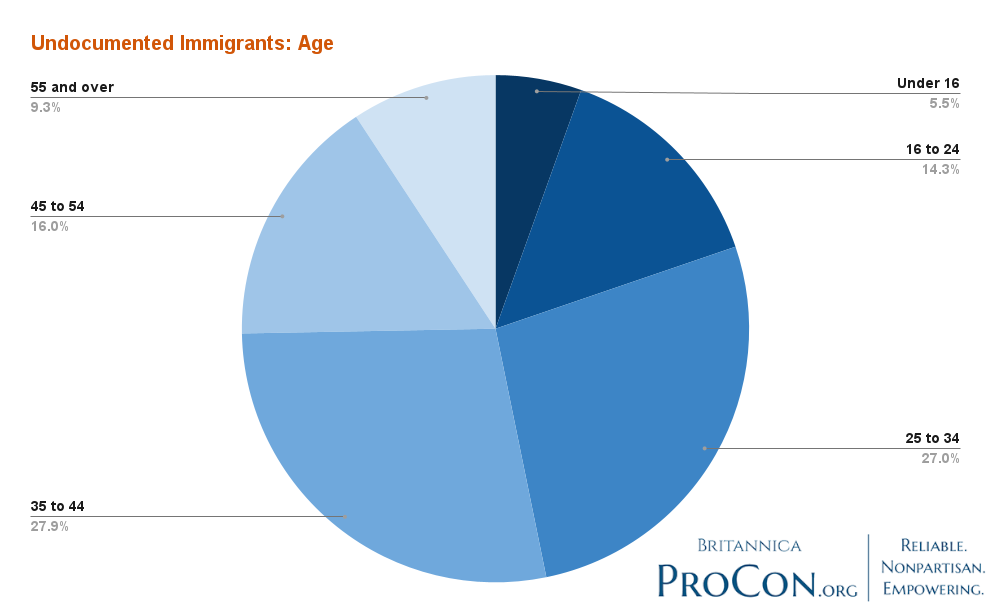
| Age | Undocumented Population in the United States | % of Total Undocumented Population in the United States |
|---|---|---|
| Under 16 | 606,000 | 5% |
| 16 to 24 | 1,577,000 | 14% |
| 25 to 34 | 2,986,000 | 27% |
| 35 to 44 | 3,084,000 | 28% |
| 45 to 54 | 1,772,000 | 16% |
| 55 and over | 1,023,000 | 9% |

| Sex | Undocumented Population in the United States | % of Total Undocumented Population in the United States |
|---|---|---|
| Female | 5,062,000 | 46% |
| Male | 5,985,000 | 54% |

| Marital Status | Undocumented Population in the United States | % of Total Undocumented Population in the United States |
|---|---|---|
| Never Married | 4,057,000 | 39% |
| Married to US Citizen | 4,057,000 | 12% |
| Married to LPR (Legal Permanent Resident) | 654,000 | 6% |
| Married to Non-Citizen/LPR (Legal Permanent Resident) | 2,822,000 | 27% |
| No Longer Married (Divorced, Separated, or Widowed | 1,665,000 | 16% |

| Children | Undocumented Population in the United States | % of Total Undocumented Population in the United States |
|---|---|---|
| At Least One US-Citizen Minor | 3,521,000 | 33% |
| Noncitizen Minors Only | 3,521,000 | 8% |
| No Children | 6,185,000 | 59% |
School Enrollment (3-17 Years Old)

| Enrollment Status | Undocumented Population in the United States | % of Total Undocumented Population in the United States |
|---|---|---|
| Enrolled | 651,000 | 89% |
| Not Enrolled | 83,000 | 11% |
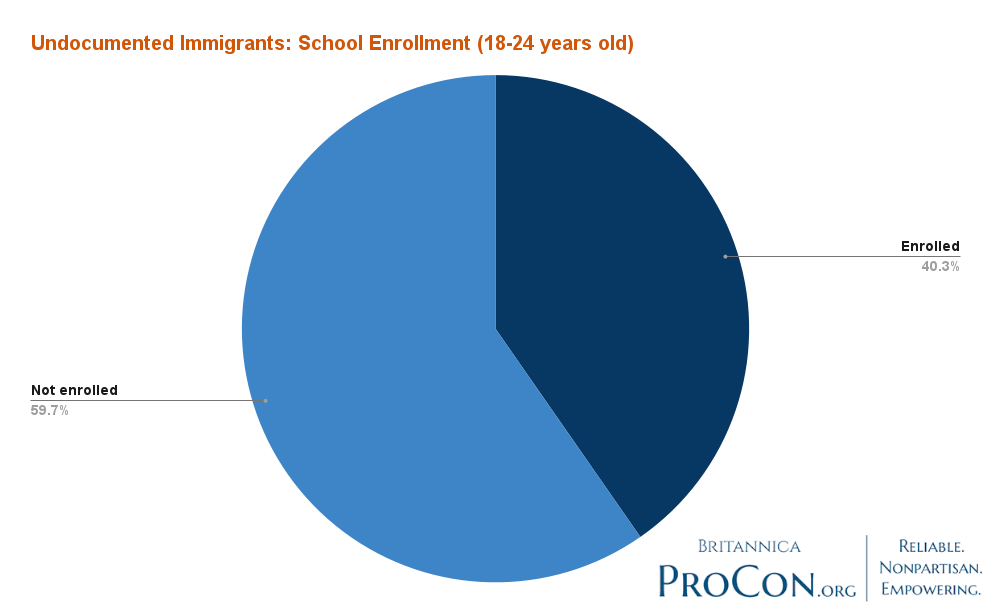
School Enrollment (18-24 Years Old)
| Enrollment Status | Undocumented Population in the United States | % of Total Undocumented Population in the United States |
|---|---|---|
| Enrolled | 569,000 | 40% |
| Not Enrolled | 842,000 | 60% |
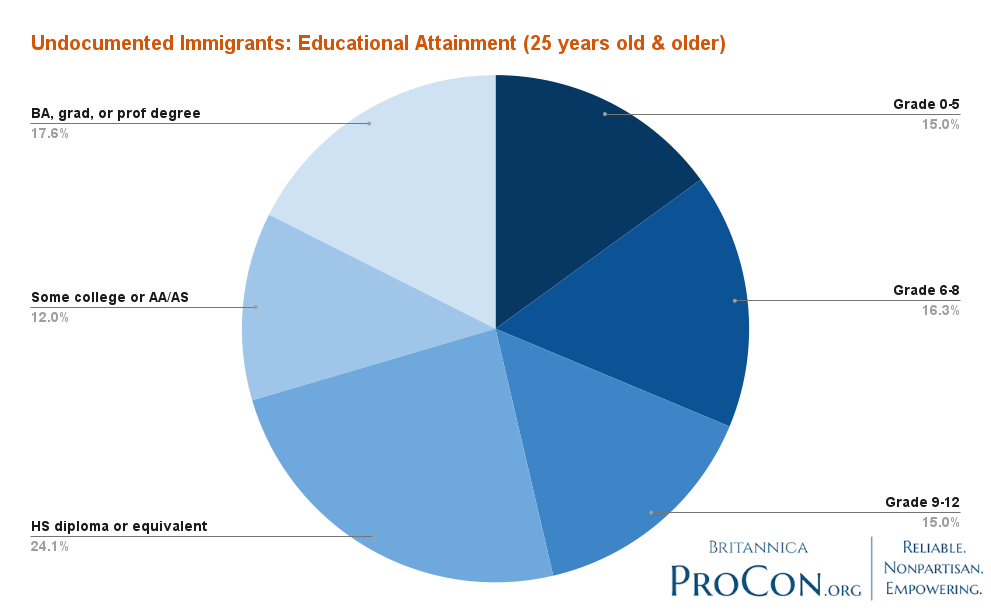
Educational Attainment (25 Years Old & Older)
| Educational Attainment | Undocumented Population in the United States | % of Total Undocumented Population in the United States |
|---|---|---|
| Grade 0-5 | 1,330,000 | 15% |
| Grade 6-8 | 1,444,000 | 16% |
| Grade 9-12 | 1,334,000 | 15% |
| High School Diploma or Equivalent | 1,334,000 | 24% |
| Some College or Associate's Degree (AA/AS) | 1,062,000 | 12% |
| Bachelor's (BA/BS), Graduate (MA/MS/MFA/PHD/etc), or Professional Degree (MD/JD/etc) | 1,558,000 | 18% |
English Proficiency (Ages 5 & up)

| English Proficiency | Undocumented Population in the United States | % of Total Undocumented Population in the United States |
|---|---|---|
| Speak only English | 773,000 | 7% |
| Speak English "Very Well" | 2,734,000 | 25% |
| Speak English "Well" | 2,450,000 | 22% |
| Speak English "Not Well" or "Not at All" | 4,994,000 | 46% |
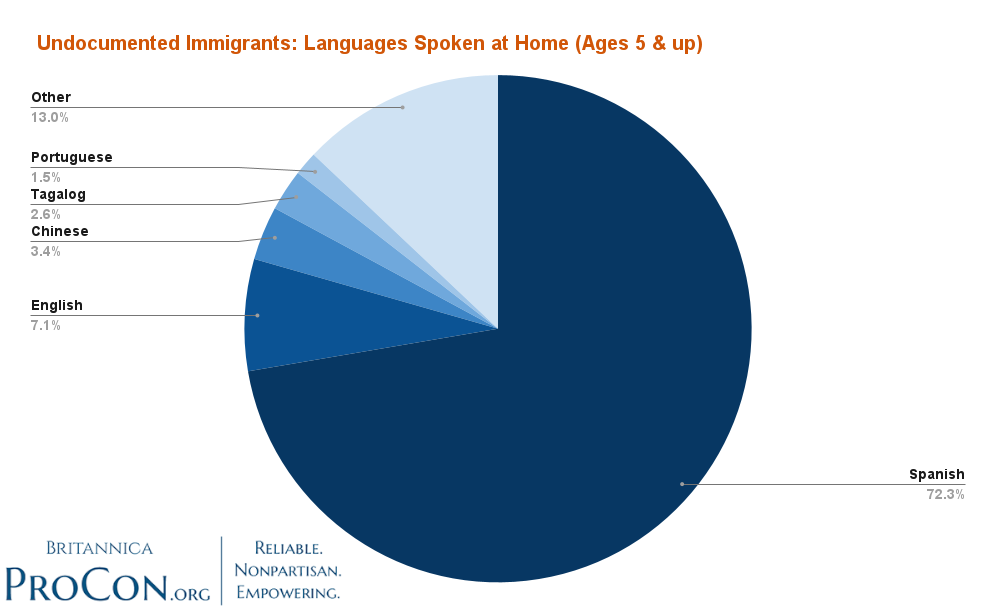
Languages Spoken at Home (Ages 5 & up)
| Language | Undocumented Population in the United States | % of Total Undocumented Population in the United States |
|---|---|---|
| Spanish | 7,919,000 | 72% |
| English | 780,000 | 7% |
| Chinese | 377,000 | 3% |
| Tagalog | 290,000 | 3% |
| Portuguese | 166,000 | 2% |
| Other | 1,419,000 | 13% |
Employment Status (Ages 16 & up)

| Employment Status | Undocumented Population in the United States | % of Total Undocumented Population in the United States |
|---|---|---|
| Employed | 6,829,000 | 65% |
| Unemployed | 448,000 | 4% |
| Not in the Labor Force | 3,157,000 | 30% |
Migration Policy Institute, “Profile of the Unauthorized Population: United States,” migrationpolicy.org (accessed June 22, 2022)